Project Dashboard
shows up-to-date statistics about the current project. In addition to summary information, the dashboard includes three interactive graphics that allow you to view different aspects of the data, such as by custodian, hit rate, or reviewed status.
Project Managers and Client Administrators can view Project Dashboards. To view this dashboard, go to your profile and select . The following figure shows an example Project Dashboard.
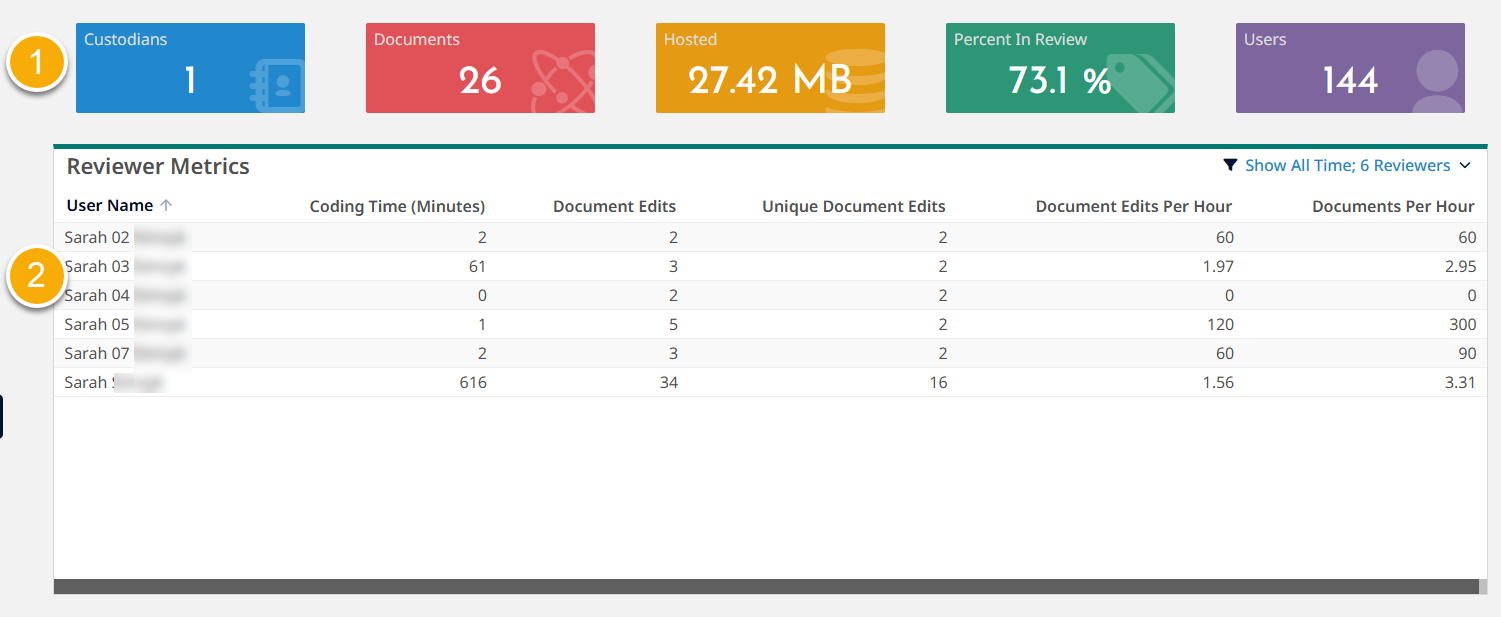
- Summary information at the top of the page includes the following project-specific information.
- - total number of active custodians in the project.
-
- total number of processed and pending for processing (collected) documents in the project. This number does not include deleted documents, which are immediately removed from this total.
Note that the displayed document count in the project might not align with the document count in INSPECT if there are collected documents that have not been processed because INSPECT only shows and counts processed documents. - - total hosted space, including documents in search index, database, and file hosting. This number includes loaded documents and concealed documents. This number does not represent peak hosting.
-
- percent of promoted documents in the project. This number includes loaded documents and concealed documents. This number does not include deleted documents, which are immediately removed from this total.
Percent hit rate = (total number of documents in Review / documents in the project) X 100. - - number of active users with access to the project. Active users include the Client Administrator, Project Manager, Litigation Support, Review Manager, Senior Reviewer, and Reviewer roles.
- lists the document collection count for each custodian by source. Alternatively, you can view the list by document size. In addition, you can limit the sources shown to those relevant to your project. You can specify a filtered data set using the following dropdown.
- Select one of the following, where is selected by default.
- - Total number of documents collected for each custodian across the specified sources.
- - Total collected documents for each custodian across the specified sources.
- - Click the sources filter to add or remove sources to include.
- Select one of the following, where is selected by default.
-
shows the percent of collected documents promoted for review. The hit rate percentage varies as you promote and delete documents. You can view hit rate data by all custodians or by individual custodian. The hit rate percentage color reflects different percentage ranges.
Hit rate = (Documents in review / Documents in the project) * 100.
- Red indicates less than 30%
- Orange indicates greater than 30% but less than 60%
- Yellow indicates greater than 60% but less than 90%
- Green indicates greater than 90%
-
shows the current review progress and predicts the daily review progress to a review completion date. Documents in completed batches are "reviewed documents". The x-axis shows the date range and the y-axis shows the total number of assigned documents. If there are no assignments, the graph is empty. Documents coded outside the assignment process do not appear in the graph.
You can view the progress for all assignments or individual assignments. In addition, you can view current progress, predicted progress, or both.
- - Graphs the total number of documents pending for review either across all assignments starting from the first assignment's creation date or across a specific assignment and its creation date.
- -Shows a graphic representation of how long the review could take, based on the number of documents left and the current average per day.
Predicted number of days left in review = the total documents left / the current average per day
Suppose the first assignment day was 10 days ago, the number of documents across all assignments is 1000, and the number of documents that were reviewed since the start of the assignment is 250. The average documents per day so far is 250 / 10 = 25. The remaining documents to be reviewed is 1000 - 250, or 750. To review 750 documents, averaging 25 a day would take approximately 30 days.
Related: Client Dashboard